
TL;DR:
- Stat charting provides objective data to identify subtle patterns and improve decision-making.
- Visual tools like shot charts enhance understanding of scoring tendencies and defensive weaknesses.
- Using stats alongside film refines player feedback and promotes targeted development.
Watching every game closely feels like enough. You see the missed rotations, the forced passes, the player who disappears in the fourth quarter. But memory is selective, and observation alone leaves gaps. Coaches who rely purely on instinct often miss the quiet patterns that define a team’s ceiling. Stat charting changes that. It gives you an evidence-based foundation for every decision, from lineup choices to individual feedback sessions. This guide breaks down why charting matters, which numbers to track, and how to turn raw data into real results on the court.
Table of Contents
- The limits of intuition: Why tracking stats elevates coaching
- Core stats every coach should chart (and why they matter)
- Turning numbers into insights: Shot charts and visual tools
- Developing players with targeted feedback and growth metrics
- What most coaches get wrong—and how to chart smarter
- Take your coaching further with proven Hoop Mentality resources
- Frequently asked questions
Key Takeaways
| Point | Details |
|---|---|
| Stat charting beats intuition | Collecting structured player stats provides more accurate insights than relying on memory or gut feel. |
| Visual tools drive results | Shot charts and visualizations turn raw data into practical adjustments for individuals and teams. |
| Data powers player growth | Tracking KPIs lets coaches give targeted feedback to accelerate skill development and team cohesion. |
| Balanced analytics wins | Combining stat data with context and film delivers smarter coaching decisions than either alone. |
The limits of intuition: Why tracking stats elevates coaching
Let’s start with why intuition alone often isn’t enough.
Your brain processes a basketball game at high speed. You’re reading defensive positioning, calling plays, managing substitutions, and tracking foul trouble all at once. In that environment, memory becomes unreliable. You remember the flashy plays and the obvious mistakes. You miss the subtle ones.
A player who gives up three defensive breakdowns in the first half might not register unless you’re specifically tracking it. A role player who sets ten screens per game and creates open looks for teammates rarely shows up in a box score. These contributions and lapses are invisible to pure observation.
Stat charting fixes this. It creates an objective record of what actually happened, not what you remember happening. That record lets you verify your instincts or correct them.
Here’s what coaches commonly miss without systematic tracking:
- Defensive lapses that repeat across multiple games but never feel consistent in memory
- Quiet contributors whose effort doesn’t show in points or assists
- Turnover patterns linked to specific game situations or defensive pressure
- Foul tendencies that predict lineup problems before they become crises
- Shot selection drift when a player starts forcing shots under fatigue
The value of analytics in basketball isn’t just professional. It applies at every level. Michigan’s program demonstrates this clearly. Live tracking of possessions, turnovers, and fouls during games enables in-game adjustments and post-game analysis for strategic improvements.
“The numbers don’t replace what you see. They confirm what you should be seeing more clearly.”
That’s the real shift. Charting doesn’t make you a data analyst. It makes you a sharper coach.
Core stats every coach should chart (and why they matter)
Now that we see the cost of insufficient data, here are the stats that matter most.
Not every number is worth tracking. You want data that directly connects to decisions. Shot types, shot zones, assists, turnovers, fouls, and rebounds form the foundation. Each one tells a specific story about player performance and team dynamics.
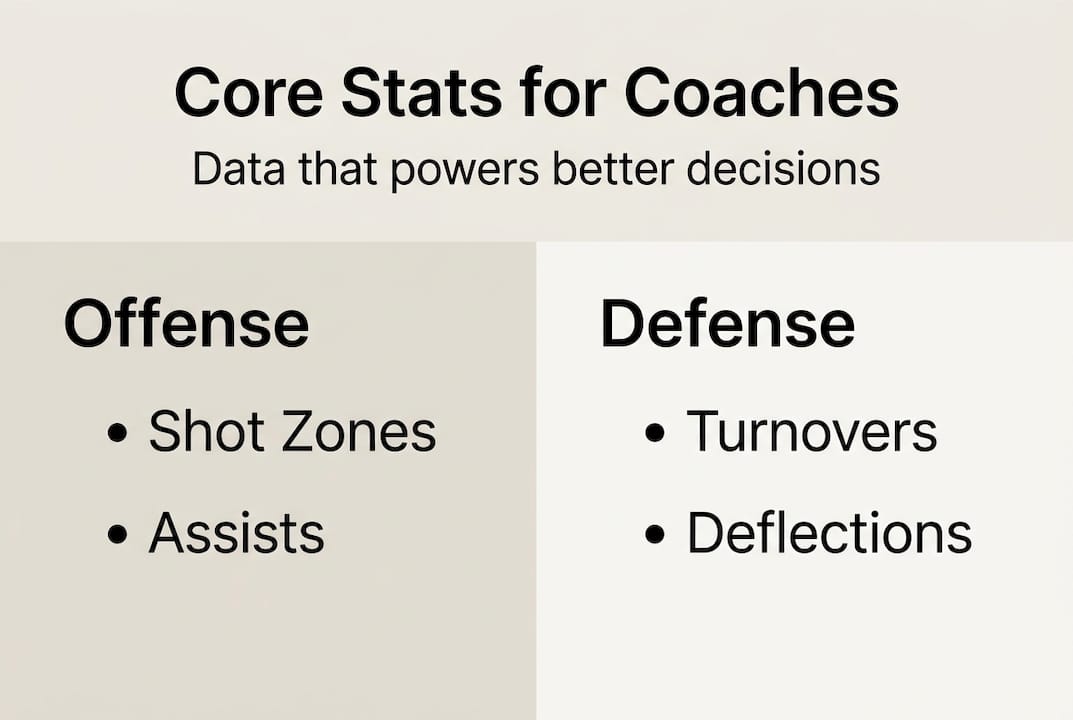
| Stat | What it reveals | Decision it supports |
|---|---|---|
| Shot zone efficiency | Where a player scores vs. where they shoot | Shot selection coaching |
| Assist/turnover ratio | Decision-making quality | Playmaker evaluation |
| Defensive rebounds | Effort and positioning | Lineup matchups |
| Foul rate | Discipline and aggression | Rotation management |
| On/off differential | Lineup impact | Substitution strategy |
Advanced metrics like TS%, PER, Net Rating, and on/off differentials provide nuanced benchmarks for player efficiency, pace adjustment, and overall contribution beyond box scores. These numbers go deeper than traditional stats and give you a clearer picture of actual player value.
Pro Tip: You don’t need expensive software to start. A clipboard and a simple tally sheet work fine for basic charting. Explore essential analytics tools when you’re ready to scale up.
Here’s a simple process to get started:
- Choose three to five core stats that match your team’s current focus areas
- Assign a manager or assistant to track during games using a printed template
- Review the data within 24 hours while game context is still fresh
- Compare trends across three or more games before drawing conclusions
- Use the data in your next individual player meeting with specific examples
This process keeps charting manageable and directly tied to coaching action. The goal is usable information, not a perfect database.
Turning numbers into insights: Shot charts and visual tools
Collecting numbers is just the start. Visualization is what truly empowers action.
A column of shooting percentages tells you something. A shot chart showing where those attempts cluster on the floor tells you everything. Visual tools convert abstract data into a map your players can actually understand and act on.
Shot charts visualize shooting efficiency by court zone, helping coaches design defenses to exploit weaknesses and develop optimal shot profiles for players. That’s a two-sided tool. You use it offensively to build plays around high-percentage zones. You use it defensively to push opponents toward their weakest spots.
| Feature | Traditional stat log | Shot chart |
|---|---|---|
| Clarity | Requires interpretation | Immediately visual |
| Usage in film sessions | Text-heavy, slow to review | Fast and player-friendly |
| Defensive application | Limited | Direct and specific |
| Player buy-in | Low engagement | High engagement |
Here are three direct coaching wins from visual analysis:
- Matchup planning: Identify which defender to assign based on opponent shot zone tendencies
- Hot spot development: Build practice drills around a player’s highest-efficiency zones
- Weak area targeting: Create defensive schemes that funnel opponents away from their comfort zones
Pro Tip: Print shot charts before individual review sessions. Showing a player exactly where their shots are coming from creates faster understanding than any verbal explanation. Start with using shot charts to build your process, then use a shot chart template to standardize your tracking. Pair visual data with shot selection strategies for maximum practice impact.
NBA and college programs have used shot chart data to completely reshape defensive schemes. When you know an opponent shoots 42% from the right corner and 28% from the left, your defensive rotations become deliberate instead of reactive.
Developing players with targeted feedback and growth metrics
With clear visual information, delivering effective feedback and personalized improvement becomes much easier.
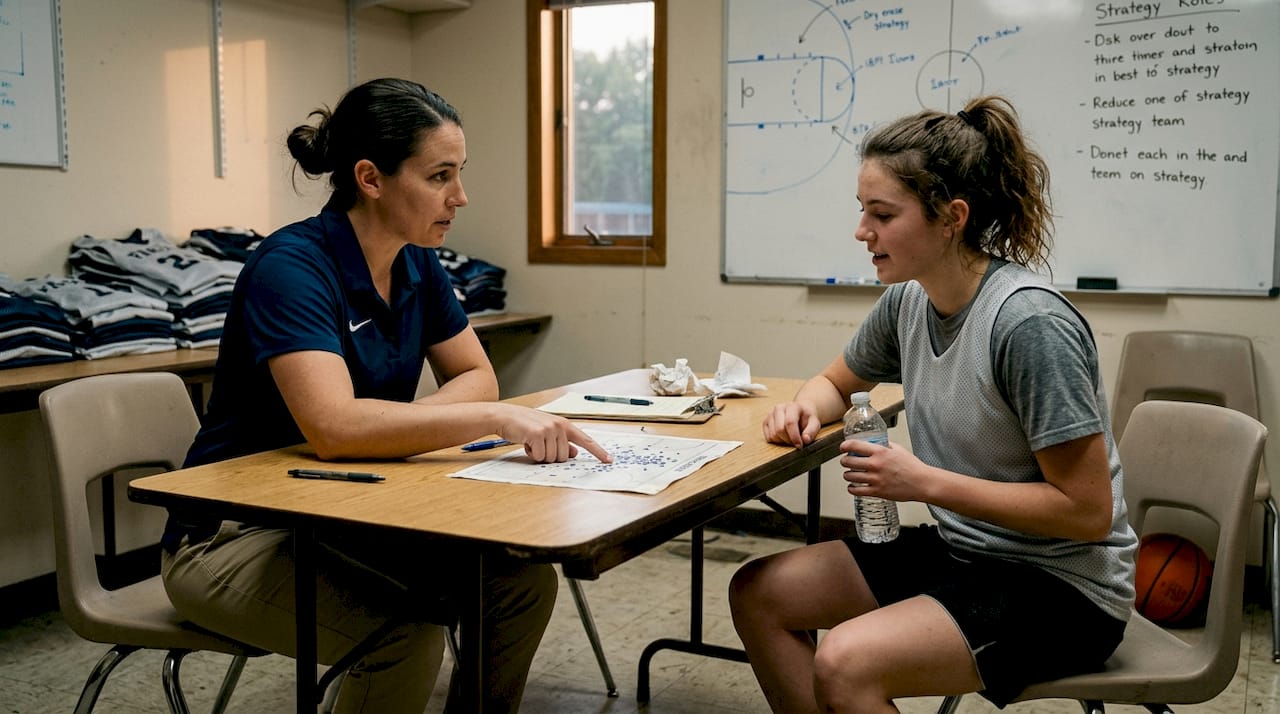
Generic feedback doesn’t stick. Telling a player to “make better decisions” is forgettable. Showing them their assist-to-turnover ratio dropped from 2.8 to 1.4 over the last four games is specific, and specific feedback drives change.
KPI-based tracking reveals what each player actually needs. One guard might need shot zone discipline. A big man might need defensive rebounding consistency. A wing might need to reduce transition fouls. Charted stats make these needs visible and undeniable.
Here’s the kind of feedback charted data makes possible:
- “Your turnover rate triples in the fourth quarter. Let’s look at your decision-making under fatigue.”
- “You’re shooting 18% from mid-range but 54% at the rim. Let’s shift your shot profile.”
- “Your defensive rating improves by 8 points when you’re paired with this specific lineup.”
- “Your assist numbers are strong, but your off-ball movement drops when you’re not handling.”
Charting supports player development by tailoring training to specific KPIs like assist/turnover ratio and defensive rating, with empirical success in programs like Michigan’s analytics-driven approach. This isn’t just theory. Programs using metric-led development see faster individual improvement because players understand exactly what to work on.
Pro Tip: Share one specific stat with each player per week. Not five. One. Give them a single number to own and improve. This keeps accountability focused and progress measurable.
A skills development workflow helps you connect data to practice design. Pair that with practice drills for skill-building and structured feedback methods to complete the loop from data to development.
Stat charting also builds accountability culture. When players know their numbers are being tracked, effort becomes visible. That visibility motivates.
What most coaches get wrong—and how to chart smarter
Here’s an uncomfortable truth: collecting stats is easy. Using them wisely is the hard part.
Many coaches start charting and then let the numbers do too much work. They see a low assist total and bench a player. They see a high PER and trust a player in critical moments. But stats without context are incomplete. Film plus stats is the real combination. Numbers confirm what you see on film. Film explains what the numbers can’t.
Role players are especially tricky. Their stats shift with deployment. A player logging 12 minutes per game will have different numbers than the same player at 28 minutes. Role players’ stats vary by deployment, while transcendent stars provide more reliable signals. Michigan’s analytics staff uses data to confirm thoughts from film, deliberately avoiding over-reliance on numbers alone.
That’s the model worth following. Use stats as a starting point for questions, not a final answer. When a number looks surprising, go to film. When film shows something you can’t explain, go to the stats. The two tools work together, not in isolation.
For a deeper look at applying this balance, evaluating player performance with both lenses produces the most accurate read. Numbers are a springboard. Your coaching judgment is still the landing.
Take your coaching further with proven Hoop Mentality resources
Ready to put advanced stat charting into practice?
Hoop Mentality builds tools specifically for coaches who want structure without the guesswork. Every resource is designed around real coaching needs.
Start with the Big Man Dual Action Drill to connect your data insights directly to skill-building sessions. Use the Weekly Practice Plan Guide to organize your preparation around the metrics that matter most. All resources are available at Hoop Mentality, built for coaches at every level. Practical tools. Clear structure. Real results.
Frequently asked questions
What are the top three player stats every coach should chart in games?
Focus on shot efficiency by zone, assist-to-turnover ratio, and defensive impact rating. These three give you the clearest picture of where each player helps or hurts the team.
How do shot charts improve team strategy?
They reveal scoring patterns and defensive gaps, making it straightforward to build targeted drills and adjust game plans based on zone-specific shooting data.
Can stat charting help less experienced coaches make better decisions?
Yes. Objective stats reduce memory bias and give newer coaches concrete benchmarks. Live tracking of possessions and turnovers supports both in-game and post-game decision-making with real evidence.
How do advanced metrics like PER help basketball coaches?
They provide pace-adjusted evaluation of player value that goes beyond basic box scores. Advanced metrics like TS%, PER, and Net Rating improve roster management and help coaches identify true contributors.
Recommended
- Why Use Shot Charts: Boosting Team Performance – Hoop Mentality
- How to Evaluate Player Performance in Basketball Effectively – Hoop Mentality
- Role of Analytics in Basketball Success Today – Hoop Mentality
- Basketball analytics checklist: Essential tools and metrics – Hoop Mentality
- Why track player performance in fantasy tennis (2026)