
Over 90 percent of American basketball coaches now use shot charts to guide their decisions, yet misconceptions about these tools are everywhere. Shot charts look simple, but interpreting them incorrectly can lead to wasted practice hours and missed opportunities on the court. Knowing the truth behind how shot charts really work helps coaches and players avoid common traps and gain a genuine edge in performance analysis.
Table of Contents
- Shot Charts Defined And Common Misconceptions
- Main Types Of Shot Charts In Basketball
- How Coaches Analyze And Interpret Shot Data
- Improving Player Development With Shot Charts
- Mistakes To Avoid When Using Shot Charts
Key Takeaways
| Point | Details |
|---|---|
| Understanding Shot Charts | Shot charts offer essential insights into player shooting performance but must be interpreted in the context of other performance metrics. |
| Types of Shot Charts | Different shot chart types, like Dot Style and Heat Maps, provide nuanced visualizations of shooting data, helping coaches analyze performances effectively. |
| Advanced Analytical Techniques | Coaches should apply advanced statistical methods and spatial analysis to reveal deeper shooting patterns and improve player development strategies. |
| Common Misinterpretations | It’s crucial to recognize the limitations of shot charts, including spatial inaccuracies and the importance of game context in analyzing shooting performance. |
Shot Charts Defined And Common Misconceptions
A shot chart is a visual representation of shooting performance that maps out made and missed shots across a basketball court. These graphics provide coaches and analysts with critical insights into player shooting tendencies, spatial distribution of scoring attempts, and potential strategic improvements. Understanding the role of scouting templates can enhance how teams interpret and utilize shot chart data effectively.
Traditional shot charts often suffer from significant limitations that can mislead coaches and players. Spatio-temporal dynamics of basketball performance are frequently overlooked, which means many visual representations fail to capture the full complexity of shooting patterns. Conventional charts typically depict shooting locations without accounting for critical factors like defensive pressure, player movement, or contextual game situations.
Key misconceptions about shot charts include assuming they provide a complete picture of shooting performance. In reality, these visual tools are just one component of comprehensive player analysis. Advanced basketball scouting tools recognize that shot charts must be integrated with other performance metrics to generate meaningful insights. Coaches should understand that while shot charts reveal shooting distribution, they cannot fully explain why certain shots are successful or unsuccessful without additional context.
Main Types Of Shot Charts In Basketball
Shot charts are complex visualization tools with multiple variations designed to help coaches and players understand shooting performance. Basketball shot selection strategies become more nuanced when coaches understand the different chart types available for performance analysis.
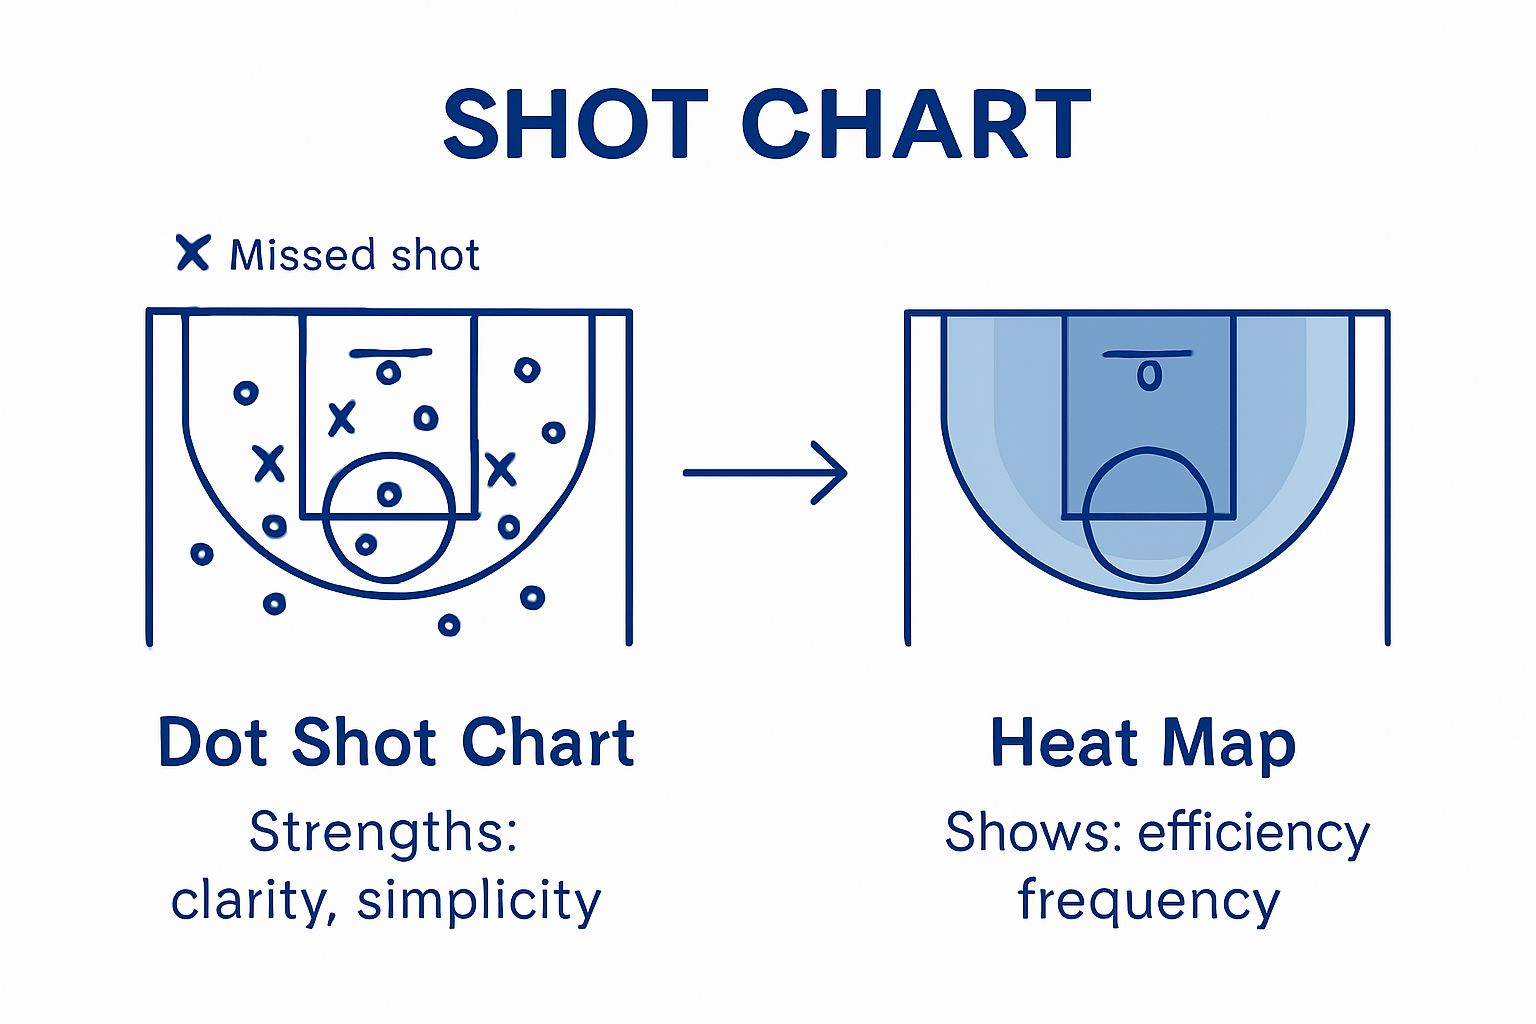
Basic shot chart types include player shot data visualization techniques such as Dot Style Shot Charts and Heat Maps. Dot Style Shot Charts use colored dots to represent made and missed shots across different court locations, allowing coaches to quickly identify shooting patterns. These charts typically employ color coding like green for successful shots and red for missed attempts, providing an immediate visual understanding of a player’s shooting performance.
Heat Maps represent another sophisticated shot chart type that visualizes shooting efficiency through color gradients. Instead of individual dots, these charts use color intensity to show shooting percentages from various court zones. Darker or more intense colors indicate higher shooting percentages, while lighter colors represent lower success rates. More advanced shot charts might also incorporate additional contextual data like shot distance, time of game, defensive pressure, and shooting angle, transforming simple location tracking into comprehensive performance analysis tools.

How Coaches Analyze And Interpret Shot Data
Analyzing shot chart data requires sophisticated approaches that go beyond simple visual interpretation. Role of analytics in basketball performance demonstrates the critical importance of understanding advanced data analysis techniques that transform raw shooting statistics into actionable insights.
Spatial analysis techniques enable coaches to develop hierarchical spatial models that uncover complex shooting patterns. These advanced models help coaches assess the spatially varying effects of different game factors, allowing for more nuanced understanding of player performance. By breaking down shooting data into granular spatial components, coaches can identify precise shooting strengths and weaknesses across different court zones.
Advanced statistical methods like Functional Bayesian Additive Regression Trees provide even deeper insights into shooting behaviors. Predictive modeling techniques allow coaches to create sophisticated models that predict potential shooting outcomes based on historical data. This approach goes beyond traditional analysis by uncovering latent patterns in shooting behavior, helping coaches develop more targeted training strategies and make more informed decisions about player positioning and shot selection.
Improving Player Development With Shot Charts
Shot charts have transformed player development strategies by providing data-driven insights into individual shooting performance. Player development tips for coaches highlight the importance of using visual analytics to create targeted improvement plans.
Competitive basketball performance analysis reveals critical variations in shot types and success rates across different skill levels. By systematically examining shot charts, coaches can identify specific weaknesses in shooting mechanics, court positioning, and decision-making. This granular approach allows for personalized training interventions that address individual player needs, transforming generic practice routines into precise skill-building exercises.
Machine learning approaches to shot selection enable coaches to uncover complex spatial patterns in player behavior. These advanced analytical techniques go beyond traditional observation, helping coaches develop sophisticated training strategies that target underlying shooting inefficiencies. By understanding the nuanced spatial structures governing player performance, coaches can design more effective drills that directly address technical limitations and strategic decision-making challenges.
Mistakes To Avoid When Using Shot Charts
Shot charts are powerful analytical tools, but coaches must understand their limitations to prevent misinterpretation. How to shoot better in basketball requires a nuanced approach that goes beyond simple visual representations.
Inaccuracies in spatial representation pose a significant challenge for coaches analyzing performance data. Many teams mistakenly neglect the physical boundaries of the basketball court, particularly along edges and corners, which can lead to fundamentally flawed strategic decisions. These spatial limitations mean that shot charts near court boundaries may not accurately reflect a player’s true shooting capabilities.
Spatio-temporal dynamics of basketball performance reveal another critical mistake: coaches who rely exclusively on spatial distribution without considering temporal aspects. Advanced shot chart analysis requires understanding not just where shots occur, but how time, defensive pressure, and game context influence shooting patterns. By avoiding these common analytical pitfalls, coaches can transform shot charts from simple visual tools into comprehensive performance insights that drive meaningful player development and strategic planning.
Elevate Your Team’s Performance with Precision Shot Chart Analysis
Understanding shot charts is key to unlocking your players’ full shooting potential. This article highlights the challenges coaches face when interpreting raw shot data and the need for advanced tools that integrate shooting patterns, spatial context, and player development strategies. If you are aiming to move beyond basic visuals and deliver targeted training that transforms shooting weaknesses into strengths you need reliable resources designed for this purpose
Discover how our Basketball Templates - Hoop Mentality provide you with professional scouting templates tailored to organize and analyze shot charts effectively. Step up your practice planning with proven frameworks found in our Basketball Workouts - Hoop Mentality collection designed specifically to address shooting mechanics and court positioning. These tools help you quickly identify shooting trends and implement focused drills so your team can shoot smarter and score more often

Take control of your team’s shooting performance today at Hoop Mentality. Access practical, easy-to-use coaching resources built from real-world experience. Start refining your shot chart analysis and maximize your players’ scoring potential now
Frequently Asked Questions
What is a shot chart?
A shot chart is a visual representation that maps out made and missed shots across a basketball court, providing insights into player shooting tendencies and performance analysis.
How do coaches use shot charts to improve player performance?
Coaches use shot charts to identify shooting patterns, strengths, and weaknesses, enabling them to develop targeted improvement plans based on detailed shooting data and analytics.
What are the different types of shot charts?
Common types of shot charts include Dot Style Shot Charts, which use colored dots to indicate made and missed shots, and Heat Maps, which display shooting efficiency through color gradients based on shooting percentages.
What mistakes should coaches avoid when analyzing shot charts?
Coaches should avoid misinterpreting shot charts by neglecting the spatial and temporal dynamics of shooting performance, as these factors can significantly influence shot effectiveness and overall player analysis.
Recommended
- Basketball Shot Chart Sheet Template - Hoop Mentality
- Basketball Shot Selection: Elevating Team Performance – Hoop Mentality
- How to Build Shooting Routines for Consistent Results – Hoop Mentality
- How To Shoot Better In Basketball? - Hoop Mentality
- Ignite Your Workout: Discover the Ultimate Energy Booster with Per4m Energy Pre-Workout Shots! ⚡️🔥 – MyGymSupplements